Welcome to the Member States - Consumption footprint tool
The Member States - Consumption footprint tool supports EU27 (2020) Member States to calculate their environmental performance over 16 impact categories including, among others, climate change, land use and human toxicity. The tool allows users to download provided and customized consumption intensity data and consumption footprint results. Member States can estimate their consumption footprint through employing different national data sources to define the consumption intensity of products.
Using the Member States - Consumption footprint tool you can:
- Analyse the Consumpion Footprint over 16 impact categories and five areas of consumption, in the General overview of impacts tab;
- Compare the overall impact with the planetary boundaries, in the General overview of impacts tab;
- Explore the temporal evolution of the Consumption Footprint, in the Explore time trends tab;
- Explore the contribution of products to the overall impact, in the Explore products contributions tab;
- Costumize the analysis by modifying the consumption intensity values, in the Consumption intensity tab;
- Find additional information, reference and sources, in the About tab.
Please check the User guide for further description of this tool and its underlying methodology.

In this section, the Consumption Footprint results for in the selected Country and year are displayed by impact category. Note that impacts can be explored with two levels of detail: per capita or for the overall Country.
Impact contribution
The table reports the Consumption Footprint by area of consumption and impact category. Results are provided for the 16 impact categories of the Environmental Footprint method and the single weighted score (i.e. following normalisation and weighting steps).
DownloadPlanetary boundaries
The Consumption Footprint per capita (i.e., environmental impact of all areas of consumption) is compared with the Planetary Boundaries per capita for each impact category. The global Planetary Boundaries are allocated following the egalitarian principle and assuming that the same share of the boundary is allocated to each individual. This graph illustrates whether impacts due to consumption are still acceptable and within the operating space of humanity (green zone) or whether they transgress capacity of ecological processes leading to potentially reach of tipping points (yellow or red zones).
In this section, the temporal evolution of the Consumption Footprint for the selected Country and impact category is displayed. Note that impacts can be explored with two levels of details: per capita or for the overall Country.
Impacts evolution over time
The temporal evolution of environmental impacts of consumption for each Member State is displayed and compared with the one of the European Union. Please note that in the visualisation at Country level, the Total score is displayed on a logarithmic axis.
Impacts evolution per consumption area
This graph illustrates the relative contribution of the different consumption areas to the overall impact over time, by impact category.
In this section, the contribution of each representative product to the impact of each area of consumption is explored by impact category, Country and year. Note that impacts can be explored with two levels of details: per capita or for the overall Country.
Representative products impact
This graph shows the impact of representative products by impact category and area of consumption. Note that impacts can be explored with two levels of details: per capita or for the overall Country.
These pie charts illustrate the relative contribution share of the most relevant representative products (right) and of the areas of consumption (left) to the selected impact category, for the selected Country and year.
The table reports the impact of each representative product in the selected area of consumption, for the selected impact category, Country and year. Data could be downloaded using the 'Download' button.
DownloadDo you want to test your own consumption intensity data for a given Member State?
This section allows customizing the analysis by modifying the consumption intensity per Country of each representative product . Consumption intensities are defined as the amount used or consumed for each product in a Member State for an entire year.
Please note that some energy consumption may overlap between more representative products. For instance, the electricity used by household appliances overlaps with energetic consumption of houses. In order to avoid doublecounting, overlapping electricity consumption was considered only once. Entering the total energy consumption is sufficient to avoid doublecounting.
Please check the User guide for further information on how to modify the consumption intensities.
These steps should be followed to customise the analysis:
- To modify a given value, double-click on the default amount value to enter a new consumption intensity value;
- Save changes by pressing Ctrl+Enter on your keyboard;
- Press 'Update analysis' button to run the entire analysis with edited intensity values;
- Download the employed consumption intensity values, using the 'Download' button;
- Save or download results in the specific tab;
- Restore the default consumption intensity data, using the 'Reset' button. Note that there is no need to press 'Update analysis' to run the entire analysis with default intensity values.
The Consumption Footprint
This interactive tool supports the analysis of the environmental impacts of the lifestyles and consumption pattern of EU Member States and their citizens. The environmental impacts of consumption are assessed by implementing the Life Cycle Assessment (LCA)-based Consumption Footprint indicator (Sala and Sanyé-Mengual, 2022; Sala et al., 2019; Sala and Castellani, 2019). Data reported in this tool are retrieved from the Consumption Footprint Platform (as of July 2022).
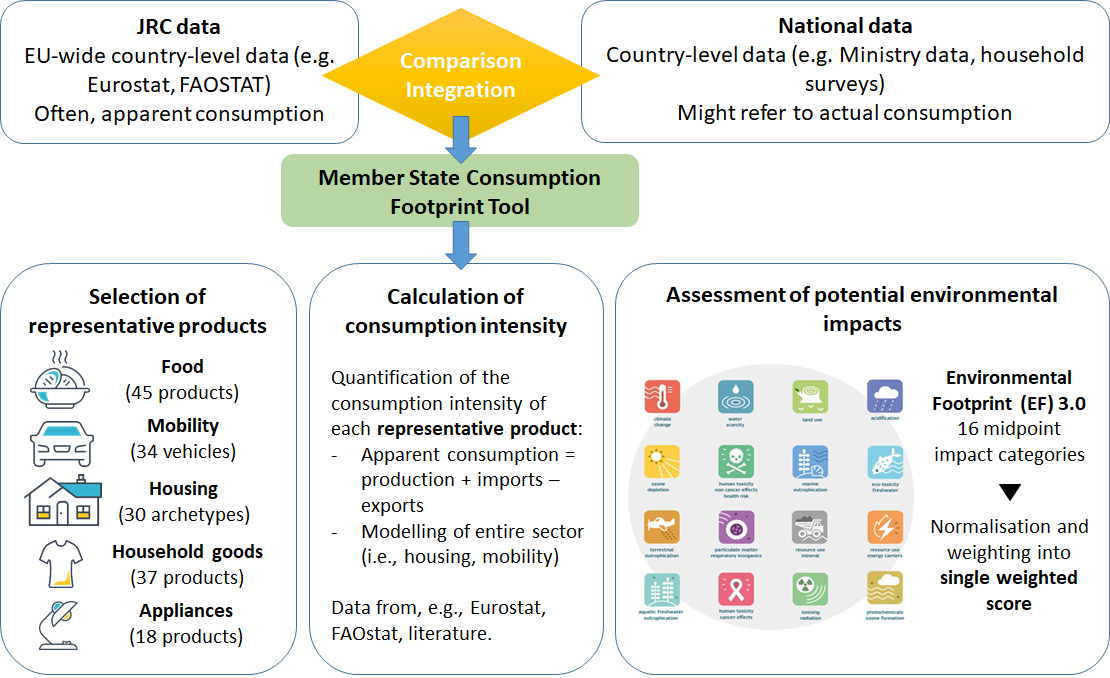
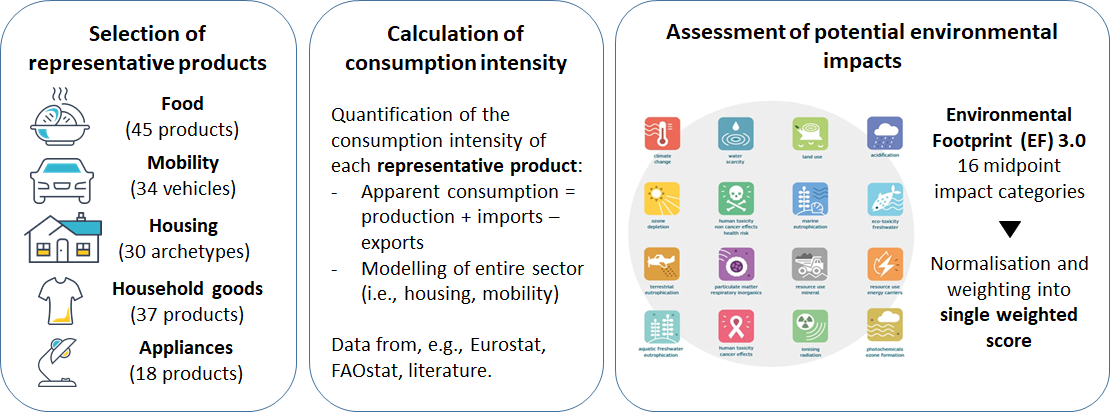
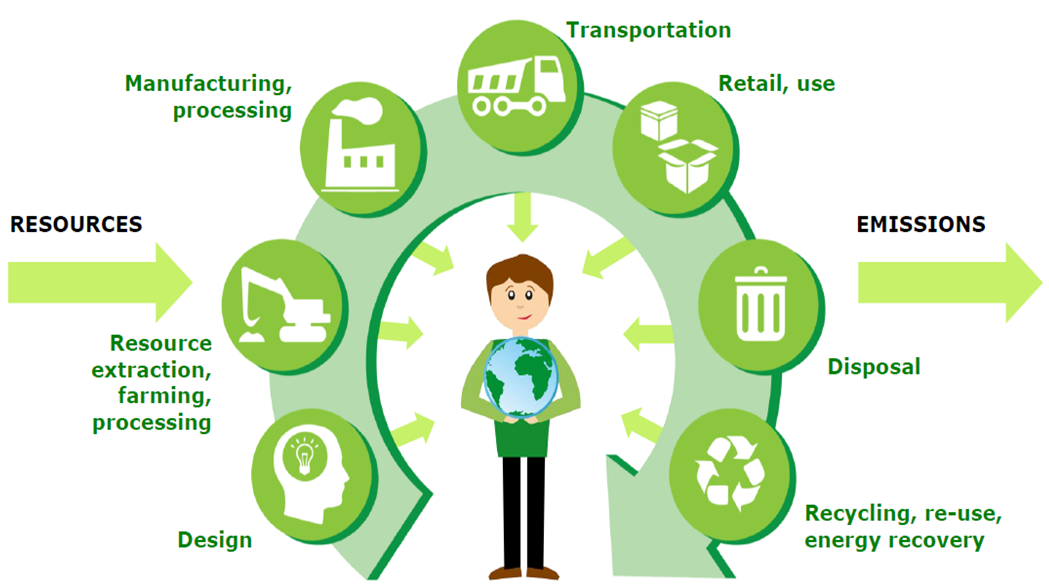
The Consumption Footprint aims to assess the potential environmental impact of consumption at the EU and Member State levels. This indicator employs processed-based LCA and has a bottom-up approach by assessing the impacts of overall consumption through 165 representative products. For each product, the consumption intensity and the environmental impacts intensity based on a full life cycle are evaluated.

LCA of products representative of the consumption of an average EU citizen
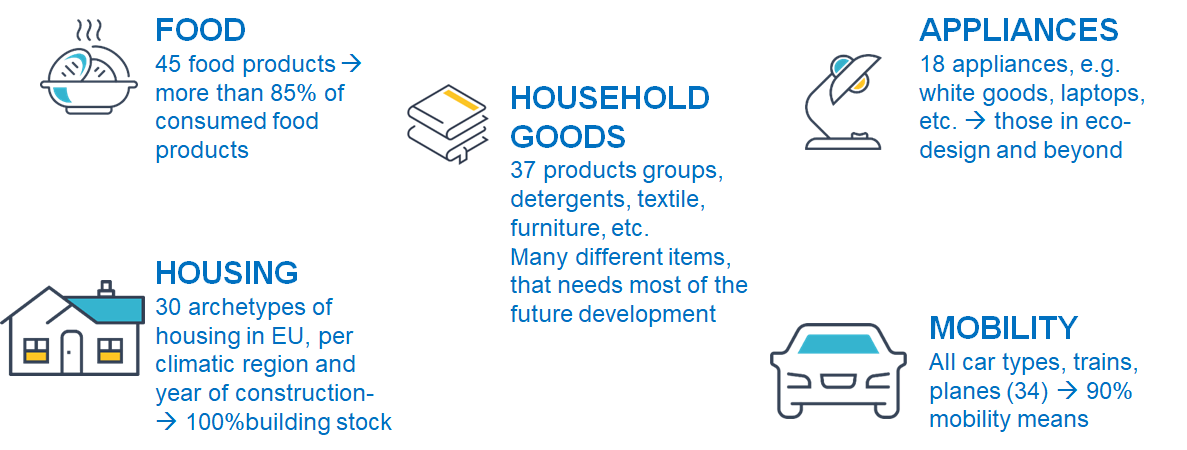
For the calculation of the Consumption footprint, the consumption of European and Member State citizens is split into five consumption areas (food, housing, mobility, household goods and appliances). For each area of consumption, a respective Basket of representative Products (BoP) is built, based on statistics on consumption and stock of products, thereby selecting the most consumed product.

The Consumption Footprint bottom-up approach
The Consumption footprint is based on the results of the life cycle assessment (LCA) of more than 165 representative products purchased and used in one year by a citizen. Life cycle inventories of representative products for each consumption area are multiplied by apparent consumption by European households.

Data sources for the calculation of consumption intensities
The data sources for the calculation of the consumption intensities by Member State and year depend on each area of consumption. Last update: July 2022.
'Food': the apparent consumption* of each representative product is calculated with data from Prodcom (Eurostat, 2020a), Comext (Eurostat, 2020b) and FAOstat (FAO, 2020).
'Appliances' and 'Household goods': the apparent consumption* of each representative product is calculated with data from Prodcom (Eurostat, 2020a), Comext (Eurostat, 2020b) and FAOstat (FAO, 2020).
'Mobility': the consumption intensity of each means of transportation is based on Eurostat (Eurostat, 2020c) and the Statistical Pocketbook 2019 (European Commission, 2019).
'Housing': the consumption intensity of the different household archetypes, water and energy is based on data from the EU Buildings database (European Commission, 2020) and Eurostat (Eurostat, 2020c). The archetypes are defined by each country depending on the climate, year of construction and type of household (multi-family or single-family house).
*: Apparent consumption is calculated as: Production + Imports - Exports. Note that this approach can lead to negative results when the trade balance (imports - exports) is negative, thereby highlighting the role of exports for that product in the given Country. The number of negative intensities are expected to decrease in future updates.
Life cycle impact assessment
Emissions to the environment and resources used are then characterized in term of potential environmental impacts in the life cycle impact assessment phase, covering the 16 impact categories recommended for the Environmental Footprint method (European Commission, 2021), including: Climate change (CC), Ozone depletion (ODP), Human toxicity, non-cancer (HTOX_nc), Human toxicity, cancer (HTOX_c), Particulate matter (PM), Ionising radiation (IR), Photochemical ozone formation (POF), Acidification (AC), Eutrophication, terrestrial (TEU), Eutrophication, freshwater (FEU), Eutrophication, marine (MEU), Land use (LU), Ecotoxicity freshwater (ECOTOX), Water use (WU), Resource use, fossils (FRD) and Resource use, minerals and metals (MRD).
Contact us
For questions, alerts, and suggestions please send an email to JRC-ConsumptionFootprint@ec.europa.eu
References
European Commission, 2019, Statistical pocketbook 2019 - EU transport in figures, 2019, Available at: https://ec.europa.eu/transport/facts-fundings/statistics/pocketbook-2019_en
European Commission, 2020, EU Buildings Database. Available at: https://ec.europa.eu/energy/eu-buildings-database_en
European Commission, 2021, Commission Recommendation of 16.12.2021 on the Environmental Footprint methods to measure and communicate the life cycle environmental performance of products and organisations. C(2021) 9332 final.
Eurostat, 2020a, Sold production, exports and imports by PRODCOM list (NACE Rev. 2) - annual data [DS-066341]. Available at: https://ec.europa.eu/eurostat/web/prodcom/data/database
Eurostat, 2020b, EU Trade since 1988 by CN8 [DS-016890]. Available at: http://epp.eurostat.ec.europa.eu/newxtweb/
Eurostat 2020c, Database of the statistical office of the European Union. Available at: https://ec.europa.eu/eurostat/data/database
Sala, S., Beylot, A., Corrado, S., Crenna, E., Sanye-Mengual, E, and Secchi, M. 2019. Indicators and Assessment of the environmental impact of EU consumption. Consumption and Consumer Footprint for assessing and monitoring EU policies with Life Cycle Assessment, Luxembourg: Publications Office of the European Union, ISBN 978-92-79-99672-6, doi: 10.2760/403263
Sala, S., and Castellani, V. 2019. The Consumer Footprint: monitoring Sustainable Development Goal 12 with process-based life cycle assessment, Journal of Cleaner Production 240, 118150, https://doi.org/10.1016/j.jclepro.2019.118050
Sala, S., and Sanyé-Mengual, E. 2022. Consumption Footprint: assessing the environmental impacts of EU consumption, European Commission. Available at: https://publications.jrc.ec.europa.eu/repository/handle/JRC126257